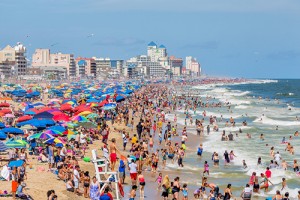
OCEAN CITY — Ocean City tourism officials this week reviewed the results of a summer-long survey of a large segment of the visitors to the resort, providing a snapshot of pertinent information such as how often they come, how long they stay, where do they stay and what do they do when they get here.
Ocean City Tourism Director Donna Abbott presented the findings of the survey to the town’s Tourism Commission on Monday. She said the survey was conducted from Memorial Day to Labor Day and roughly 2,000 visitors participated. The surveys were conducted at the Roland E. Powell Convention Center, which produced better and more tangible results than prior attempts.
“I think it has a lot of good information,” said Abbott. “Last year, we took the survey at different places and we found people didn’t want to take the time to complete it if they were on the beach or Boardwalk. In the Convention Center setting, more were willing to take the time because they were already likely there to collect information about the resort.”
Abbott said around 2,000 visitors completed the survey. One of the first pieces of information collected from the visitors was their home zip code, which can be used to create interactive maps of where Ocean City visitors come from and where to direct marketing resources. Abbott said interestingly the survey showed about 10,000 different zip codes from all over Maryland and the eastern half of the country.
“One of the things we discovered was a large number of visitors from zip codes in Ohio,” she said. “Personally, I saw a lot more Ohio license plates on the highway this summer and a lot of people from Ohio at the information booth. They love it here and they stay longer because they have to travel farther.”
One question asked visitors how many times they have visited Ocean City this year. The predominant answer was none to one, suggesting most were first-time visitors. The second highest total was two to five times, while over 10 times was the third most popular response.
Similarly, the question of how many times the participants visited the resort in the last five years received a wide variety of responses. The most popular answer was over 10 times, followed closely by two to five times, suggesting a lot of the visitors are weekenders and frequent returnees.
Perhaps the most surprising results came from a question about the length of stay. In recent years, the conventional wisdom has suggested more short weeks and extended weekend stays, but according to the survey, the most popular answer was six or more days.
Not surprisingly, the most popular answer for reason for visiting was vacation, followed by a smattering of other responses including conventions or business, special events and family events, such as weddings or birthdays.
In response to a question about the reason for choosing Ocean City, the top two answers by far were the beach and the Boardwalk. Other responses included water activities, golf, special events, entertainment and proximity to home.
When asked if they had attended the family-oriented special events, the participants were about 50-50 in their yes and no answers. For those who had attended special events, the beach fireworks was the most popular answer, followed by the beach laser shows, concerts on the beach, Sundaes in the Park, Sunset Park concerts and museum programs. Similarly, the number of participants who had planned to attend special events compared to those who came upon them without planning was about 50-50.
The final question asked participants about the ages of those in their parties, which provided a glimpse of the resort’s target audience. By far, those who participated in the survey fell into the 45-64-year-old demographic. Practically tied for second were the 31-45 and 65-75 demographics.

